If you’re studying statistics, you’ll quickly encounter symbols that look simple but can be surprisingly confusing.
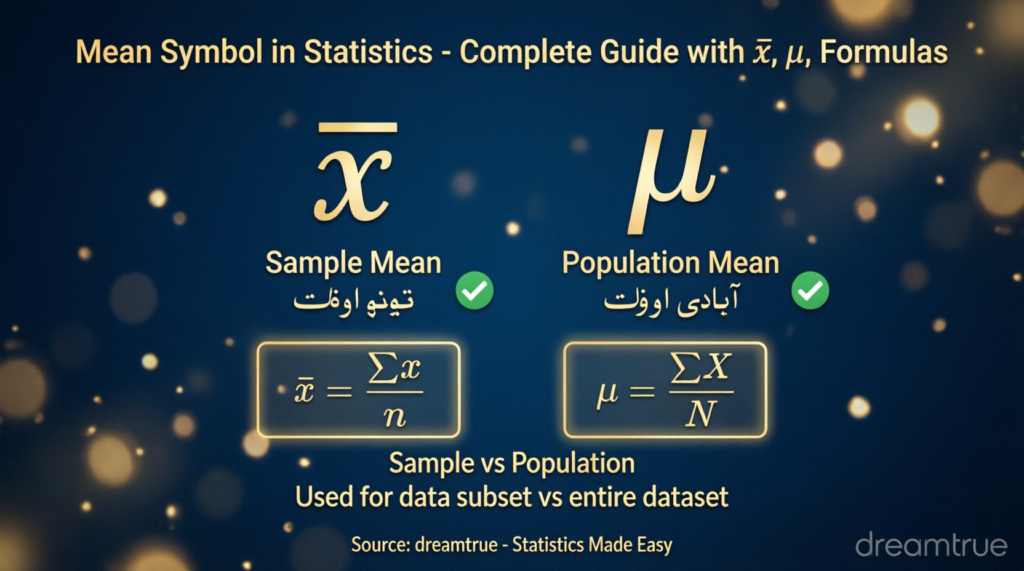
The two most important ones are x̄ and μ.
You may see x̄ in a problem involving a sample, while μ appears when a question refers to an entire population. Both are connected to the idea of a mean, or average, but they don’t represent exactly the same statistical quantity.
That small distinction matters.
The mean symbol in statistics tells you not only that you’re dealing with an average, but also whether you’re describing a sample statistic or a population parameter. Understanding this difference makes formulas for confidence intervals, hypothesis tests, standard errors, and statistical inference much easier to follow.
Let’s break it down clearly.
Featured Snippet: Mean Symbol in Statistics
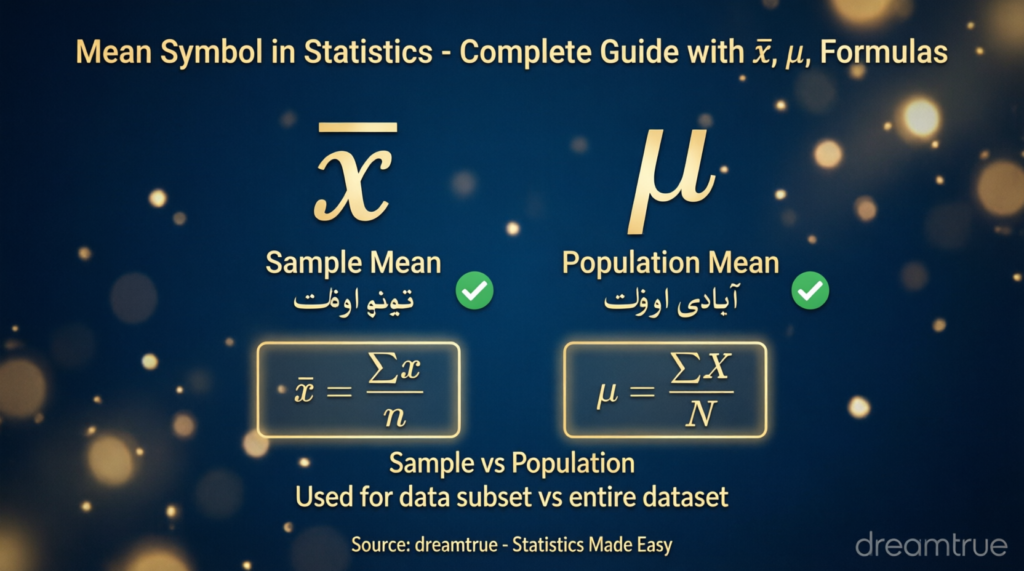
In statistics, the mean is usually represented by x̄ (x-bar) for a sample and μ (mu) for a population. Both symbols describe an arithmetic average: add all values and divide by the number of values. The key difference is whether the data come from a sample or the entire population.
Quick Answer: What Is the Symbol for Mean?
There isn’t just one universal mean symbol in statistics.
The symbol depends on what you’re averaging:
| Mean | Symbol | What it represents |
|---|---|---|
| Sample mean | x̄ | Average of a sample |
| Population mean | μ | Average of an entire population |
| Sample mean as a random variable | X̄ | The mean produced by a random sample |
| Expected value | E(X) or μ | The theoretical average of a random variable |
In most introductory statistics problems, the two symbols you need to remember are:
Sample mean = x̄
Population mean = μ
OpenStax likewise identifies x̄ as the sample mean and μ as the population mean.
What Does the Mean Symbol Mean in Statistics?
The mean is a measure of central tendency. In simple terms, it tells you where the average of a collection of numerical observations lies.
For example, suppose five students receive these scores:
70, 75, 80, 85, 90
Add them:
70 + 75 + 80 + 85 + 90 = 400
Then divide by the five observations:
400 ÷ 5 = 80
So the mean is 80.
The symbol used for that mean depends on whether those five scores represent a sample or the entire population you’re studying.
That’s why statistical notation matters.
The Two Main Mean Symbols: x̄ and μ
1. x̄ — Sample Mean Symbol
The symbol x̄ is called x-bar.
It represents the mean of a sample.
The standard formula is:
[
\bar{x} = \frac{\sum x_i}{n}
]
Where:
- x̄ = sample mean
- Σ = sum of
- xᵢ = each observation in the sample
- n = sample size
Example
Suppose you randomly select five employees and record their ages:
22, 25, 27, 30, 31
Calculate the sample mean:
[
\bar{x} = \frac{22+25+27+30+31}{5}
]
[
\bar{x} = \frac{135}{5}
]
[
\bar{x}=27
]
Therefore:
x̄ = 27 years
Because these five employees are a sample rather than necessarily every employee in the population, the appropriate notation is x̄.
2. μ — Population Mean Symbol
The Greek letter μ, pronounced mu, represents the population mean.
The population mean formula is:
[
\mu = \frac{\sum x_i}{N}
]
Where:
- μ = population mean
- Σ = sum of
- xᵢ = each population value
- N = population size
Example
Imagine a school has exactly four students in a particular group, and you have the scores of every student:
70, 80, 90, 100
Then:
[
\mu = \frac{70+80+90+100}{4}
]
[
\mu = \frac{340}{4}
]
[
\mu = 85
]
Because you’ve included every member of the population being studied, the mean is the population mean:
μ = 85
OpenStax gives the same distinction: the population mean uses μ, while the sample mean uses x̄.
x̄ vs μ: What’s the Difference?
This is probably the most important distinction to remember.
| Feature | Sample Mean | Population Mean |
|---|---|---|
| Symbol | x̄ | μ |
| Pronunciation | x-bar | mu |
| Describes | A sample | Entire population |
| Type | Statistic | Parameter |
| Formula | x̄ = Σx / n | μ = Σx / N |
| Typical use | Estimate population mean | Describe population |
| Sample size symbol | n | N |
The easiest way to remember
Think:
x̄ → sample
μ → population
The sample mean is calculated from observed sample data and is commonly used to estimate the unknown population mean.
Why Do Statistics Use Different Symbols for Mean?
The distinction exists because a sample and a population are not the same thing.
Imagine you want to know the average height of every adult in a country.
Measuring every person could be impractical or impossible. Instead, you might select a random sample of people and calculate their average height.
The sample produces:
x̄
The population has:
μ
You use x̄ to learn about μ.
That’s one of the central ideas behind inferential statistics.
In simple terms
x̄ is what you calculate from your sample.
μ is the population value you’re trying to understand or estimate.
Mean Symbol Statistics Formula
The basic arithmetic mean follows one simple idea:
[
\text{Mean}=\frac{\text{Sum of values}}{\text{Number of values}}
]
For a sample:
[
\boxed{\bar{x}=\frac{\sum x_i}{n}}
]
For a population:
[
\boxed{\mu=\frac{\sum x_i}{N}}
]
The formulas look almost identical.
The important difference is n versus N.
- n generally represents the sample size.
- N generally represents the population size.
OpenStax presents these population and sample mean formulas using exactly this distinction.
What Does the Bar Over x Mean?
The horizontal line above the x in x̄ is called an overbar, or simply a bar.
So:
x̄ = x-bar
The bar tells you that you’re dealing with the mean of the x-values.
For example:
[
\bar{x} = \frac{x_1+x_2+x_3+x_4}{4}
]
Here, x₁, x₂, x₃, and x₄ are individual observations, while x̄ is their average.
Why not just use x?
Because x can represent an individual observation or variable.
The bar makes the notation more specific:
x = an individual value
x̄ = the sample mean
What Does μ Mean?
μ is the Greek letter mu.
In statistics, it commonly represents the population mean.
For example:
[
\mu=75
]
means the population’s average value is 75.
You may encounter μ in:
- probability distributions
- normal distributions
- hypothesis testing
- confidence intervals
- statistical estimation
- z-scores
- sampling distributions
For example, the standardized z-score formula is often written as:
[
z=\frac{x-\mu}{\sigma}
]
Here:
- x = individual observation
- μ = population mean
- σ = population standard deviation
Sample Mean vs Population Mean: A Simple Example
Let’s make the distinction practical.
Suppose a university has 10,000 students.
You want to know the average number of hours students study each week.
You randomly select 100 students and calculate their average:
[
\bar{x}=14.6
]
The 100 students are your sample.
So 14.6 is the sample mean.
The average study time for all 10,000 students would be the population mean:
[
\mu
]
You may not know μ.
Instead, you use x̄ as an estimate of μ.
This is exactly how statistical sampling turns a manageable amount of data into information about a much larger population.
Is x̄ a Statistic or a Parameter?
This is another common exam question.
x̄ is a statistic.
A statistic is calculated from sample data.
Therefore:
[
\boxed{\bar{x}=\text{sample statistic}}
]
μ is a parameter.
A parameter describes a population.
Therefore:
[
\boxed{\mu=\text{population parameter}}
]
Easy memory trick
Sample → Statistic → x̄
Population → Parameter → μ
This distinction becomes especially important in inferential statistics.
Is the Mean Always Written as x̄?
No.
The notation can change depending on context.
For introductory statistics:
- x̄ commonly means sample mean.
- μ commonly means population mean.
But in probability and mathematical statistics, you may see:
[
\bar{X}
]
with a capital X.
This often represents the random variable corresponding to a sample mean, whereas lowercase x̄ may represent the actual numerical mean calculated from an observed sample.
That distinction is subtle but useful.
Example
Before collecting data:
[
\bar{X}
]
can represent a random sample mean.
After collecting the observations, you might calculate:
[
\bar{x}=72.4
]
So one notation can refer to the random quantity, while the other refers to its observed value.
Not every introductory textbook emphasizes this distinction, so always follow the notation used by your course or textbook.
What Is the Mean in Statistics?
The arithmetic mean is the sum of numerical observations divided by the number of observations.
For example:
4, 6, 8, 10
The mean is:
[
\frac{4+6+8+10}{4}=7
]
So:
[
\text{Mean}=7
]
The terms mean and average are often used interchangeably in everyday statistics discussions, although “arithmetic mean” is the more precise mathematical term.
How to Calculate the Sample Mean
Use these four steps.
Step 1: List the observations
For example:
10, 15, 20, 25, 30
Step 2: Add them
[
10+15+20+25+30=100
]
Step 3: Count the observations
There are:
[
n=5
]
Step 4: Divide
[
\bar{x}=\frac{100}{5}=20
]
Therefore:
[
\boxed{\bar{x}=20}
]
How to Calculate the Population Mean
The process is exactly the same, but you’re averaging all members of the population.
Suppose the population is:
12, 18, 20, 25
Then:
[
\mu=\frac{12+18+20+25}{4}
]
[
\mu=\frac{75}{4}
]
[
\boxed{\mu=18.75}
]
Because all population observations were included, the correct symbol is μ.
What Does Σ Mean in the Mean Formula?
You will often see the mean written using the Greek capital letter sigma:
[
\sum
]
This symbol means “sum” or “add all the relevant values.”
For example:
[
\sum x_i
]
means:
add all the x-values.
Therefore:
[
\bar{x}=\frac{\sum x_i}{n}
]
simply means:
Add all sample values and divide the result by the number of sample values.
Sigma notation is used to make long formulas shorter and easier to read.
Mean Symbol in Statistics: Symbols You Should Know
Once you understand x̄ and μ, you’ll encounter several related symbols.
| Symbol | Meaning |
|---|---|
| x̄ | Sample mean |
| μ | Population mean |
| X | Random variable or variable, depending on context |
| n | Sample size |
| N | Population size |
| Σ | Sum |
| σ | Population standard deviation |
| s | Sample standard deviation |
| p | Population proportion in common notation |
| p̂ | Sample proportion |
| SE | Standard error |
| E(X) | Expected value of X |
Knowing these symbols makes statistical formulas much easier to decode.
Mean Symbol vs Median Symbol vs Mode
Don’t confuse the mean with other measures of central tendency.
| Measure | Meaning | Common notation |
|---|---|---|
| Mean | Arithmetic average | x̄ or μ |
| Median | Middle value after ordering data | Often written as Median or Mdn |
| Mode | Most frequently occurring value | Often written as Mode or Mo |
The mean, median, and mode all describe the center of data, but they do so differently.
Example
Consider:
2, 3, 3, 4, 100
Mean:
[
\frac{2+3+3+4+100}{5}=22.4
]
Median:
3
Mode:
3
The mean is dramatically affected by the value 100.
That’s why the mean isn’t always the best measure of a “typical” value.
Why Outliers Matter When Using the Mean
One important weakness of the arithmetic mean is its sensitivity to extreme observations.
Consider two datasets.
Dataset A
10, 11, 12, 13, 14
Mean:
[
12
]
Dataset B
10, 11, 12, 13, 100
Mean:
[
29.2
]
One unusually large observation changes the mean substantially.
The median is much less sensitive to extreme values. OpenStax notes that outliers can affect the mean while having little or no effect on the median.
Practical lesson
Use the mean when it makes sense for the distribution and purpose of your analysis.
If extreme values or strong skewness are present, examine the median and distribution as well.
Mean Symbol and the Central Limit Theorem
The sample mean becomes particularly important in inferential statistics.
Suppose a population has:
- Mean = μ
- Standard deviation = σ
If you repeatedly draw samples of size n and calculate their means, those sample means form a sampling distribution.
Under appropriate conditions, the Central Limit Theorem tells us that this distribution becomes approximately normal as sample size increases.
Its mean is:
[
\mu_{\bar X}=\mu
]
and its standard error is:
[
SE_{\bar X}=\frac{\sigma}{\sqrt n}
]
OpenStax explains that the mean of the sampling distribution of sample means equals the population mean, while its standard deviation is the population standard deviation divided by the square root of sample size.
Why Is the Sample Mean Important?
The sample mean is much more than a way to calculate an average.
It’s one of the most important tools for making statistical inferences.
You can use x̄ to:
- estimate a population mean
- construct confidence intervals
- perform hypothesis tests
- calculate test statistics
- compare groups
- summarize experimental results
- analyze survey data
- estimate averages from large populations
For example, a confidence interval for a population mean typically starts with the sample mean as its point estimate of μ.
Mean Symbol in Confidence Intervals
Suppose you calculate:
[
\bar{x}=50
]
from a sample.
You might use x̄ to estimate the unknown population mean μ.
A simplified confidence interval has the structure:
[
\text{estimate}\pm\text{margin of error}
]
So:
[
\bar{x}\pm\text{margin of error}
]
The sample mean is therefore the center of the interval, while μ is the population parameter you’re trying to estimate.
Mean Symbol in Hypothesis Testing
The symbols x̄ and μ also appear frequently in hypothesis tests.
For example, a researcher may want to test whether a population mean differs from a specific value.
A hypothesis might be:
[
H_0:\mu=50
]
This says the null hypothesis assumes that the population mean is 50.
After collecting sample data, the researcher calculates:
[
\bar{x}
]
The sample mean is then compared with the hypothesized population mean using an appropriate statistical test.
This is another reason why confusing x̄ with μ can cause problems: one usually describes the observed sample, while the other describes the population parameter or hypothesized value.
Weighted Mean: Does It Use a Different Symbol?
A weighted mean gives different observations different levels of importance.
The general formula is:
[
\bar{x}_w=\frac{\sum w_i x_i}{\sum w_i}
]
Where:
- xᵢ = observation
- wᵢ = weight assigned to the observation
- x̄w = weighted mean
For example, if an exam is worth 60% of your grade and homework is worth 40%, simply averaging the two percentages would be incorrect. The weights must be included.
Weighted means are widely used in finance, survey analysis, education, economics, and many other fields.
Arithmetic Mean vs Geometric Mean
The word “mean” doesn’t always mean the same calculation.
The most common type is the arithmetic mean:
[
\frac{x_1+x_2+\cdots+x_n}{n}
]
But other means exist.
Arithmetic mean
Best known as the ordinary average.
Geometric mean
Useful for certain types of growth rates, ratios, and multiplicative processes.
Weighted mean
Used when observations have different importance or weights.
So when a statistics question asks for the mean without additional qualification, it usually means the arithmetic mean.
How to Type the Mean Symbol x̄
If you need to write x̄, there are several convenient options.
Copy and paste
x̄
In LaTeX
Use:
\bar{x}
which renders as:
[
\bar{x}
]
For a longer expression, you can use:
\overline{x}
In Microsoft Word
You can use Word’s equation editor and insert an overbar over x.
For μ
You can simply copy:
μ
Or enter the Greek letter through your application’s symbol or equation tools.
Mean Symbol in Excel
Excel usually doesn’t require you to type x̄ or μ manually to calculate a mean.
For a set of values in cells A1 through A5, use:
=AVERAGE(A1:A5)
Excel returns the arithmetic mean.
For example, if A1:A5 contains:
10, 20, 30, 40, 50
the result is:
30
The important point is that the software calculates the numerical mean; the statistical symbol you use in your explanation still depends on whether those values represent a sample or an entire population.
Common Mistakes With Mean Symbols
Mistake 1: Thinking x̄ and μ are identical
They both represent means, but they refer to different statistical concepts.
Correct:
- x̄ = sample mean
- μ = population mean
Mistake 2: Using N for every dataset
Typically:
- n = sample size
- N = population size
Don’t automatically assume the two are interchangeable.
Mistake 3: Forgetting what Σ means
The symbol:
[
\sum
]
means add the relevant values.
It doesn’t represent another type of average.
Mistake 4: Assuming the mean is always the “typical” value
A highly skewed dataset or one containing extreme outliers can make the mean misleading as a description of a typical observation.
Mistake 5: Confusing sample mean with sample size
Remember:
x̄ = sample mean
n = number of observations in the sample
They are completely different.
A Simple Memory Trick for x̄ and μ
If you constantly forget which symbol represents which mean, use this:
x̄ = sample
Think of the x as the observations you actually collected.
μ = population
Think of μ as the Greek symbol used for the population parameter.
Or memorize this one line:
x-bar describes the sample; mu describes the population.
That’s enough to answer many introductory statistics questions correctly.
Mean Symbol Statistics: Worked Example
Let’s solve a complete problem.
Problem
A researcher randomly selects five households and records their monthly electricity usage:
200, 250, 300, 350, 400 kWh
Find the sample mean.
Step 1: Add the observations
[
200+250+300+350+400=1500
]
Step 2: Count the observations
[
n=5
]
Step 3: Apply the sample mean formula
[
\bar{x}=\frac{\sum x_i}{n}
]
[
\bar{x}=\frac{1500}{5}
]
[
\boxed{\bar{x}=300}
]
So the average electricity usage in the sample is:
300 kWh
Because these households represent a sample, the correct symbol is x̄, not μ.
What If Those Five Households Were the Entire Population?
Now change the situation.
Suppose those five households are every household in the population being studied.
The numerical average doesn’t change:
[
\frac{1500}{5}=300
]
But the notation changes.
Now:
[
\boxed{\mu=300}
]
This is an excellent example of why the symbol depends on the statistical context, not simply the numbers.
Mean Symbol Statistics Cheat Sheet
Here’s the entire topic in one table.
| Question | Answer |
|---|---|
| What is the sample mean symbol? | x̄ |
| What is the population mean symbol? | μ |
| How do you pronounce x̄? | x-bar |
| How do you pronounce μ? | mu |
| Sample mean formula | x̄ = Σx / n |
| Population mean formula | μ = Σx / N |
| Is x̄ a statistic? | Yes |
| Is μ a parameter? | Yes |
| What does Σ mean? | Sum/add |
| What does n mean? | Sample size |
| What does N mean? | Population size |
| What is the mean? | Arithmetic average |
| Is the mean affected by outliers? | Yes |
| What is usually less affected by outliers? | Median |
Frequently Asked Questions About the Mean Symbol
What is the symbol for mean in statistics?
The most common symbols are x̄ for the sample mean and μ for the population mean.
What does x̄ mean?
x̄, pronounced “x-bar,” represents the arithmetic mean of a sample.
What does μ mean in statistics?
μ, pronounced “mu,” commonly represents the arithmetic mean of an entire population.
Is x̄ the same as μ?
Not usually. x̄ is the sample mean, while μ is the population mean. A sample mean is often used to estimate the population mean.
Is the mean a statistic or parameter?
It depends on which mean you’re talking about.
x̄ is a statistic because it comes from sample data.
μ is a parameter because it describes a population.
What is the formula for the sample mean?
[
\boxed{\bar{x}=\frac{\sum x_i}{n}}
]
Add the sample observations and divide by the sample size.
What is the formula for the population mean?
[
\boxed{\mu=\frac{\sum x_i}{N}}
]
Add all population observations and divide by the population size.
What is x-bar used for?
x-bar is used to summarize a sample and frequently to estimate the unknown population mean.
What is the Greek symbol for mean?
The Greek letter μ (mu) is commonly used for the population mean.
Why does statistics use μ for population mean?
Statistical notation uses different conventions to distinguish population parameters from sample statistics. μ is the conventional symbol for the population mean, while x̄ is commonly used for the sample mean.
What is the mean symbol in a normal distribution?
The mean of a normal distribution is commonly represented by μ. For a normal random variable, you may see notation such as:
[
X\sim N(\mu,\sigma^2)
]
where μ is the population/distribution mean and σ² is the variance.
Does the mean have a universal symbol?
No single symbol covers every statistical context. x̄ and μ are the most common introductory-statistics notations, but notation can vary by textbook, field, or mathematical context.
What is the difference between x̄ and X̄?
In more formal statistics, X̄ can represent the random variable formed by taking the mean of a random sample, while x̄ can represent the observed numerical sample mean. Introductory courses may use the notation less strictly.
Does the Mean Symbol Have a Spiritual, Biblical, or Cultural Meaning?
Not in the statistical sense.
The symbols x̄ and μ are mathematical/statistical notation. They don’t have a standard biblical or spiritual interpretation when used in a statistics problem.
Likewise, the mu symbol in statistics should not be confused with unrelated meanings of the Greek letter in other disciplines or cultural contexts.
For statistics, the relevant interpretation is straightforward:
x̄ = sample mean
μ = population mean
This is a good example of why context matters when interpreting symbols.
The Most Important Thing to Remember
If you remember only two facts from this entire guide, remember these:
[
\boxed{\bar{x}=\text{sample mean}}
]
[
\boxed{\mu=\text{population mean}}
]
And remember the formulas:
[
\boxed{\bar{x}=\frac{\sum x_i}{n}}
]
[
\boxed{\mu=\frac{\sum x_i}{N}}
]
Everything else builds from this distinction.
The sample mean x̄ is calculated from the data you have. The population mean μ describes the larger population you want to understand. In inferential statistics, x̄ is often used to estimate μ.
Conclusion
The mean symbol in statistics may look like a tiny piece of notation, but understanding it is fundamental to reading statistical formulas correctly.
The most important symbols are x̄, the sample mean, and μ, the population mean. Both represent an arithmetic average, but they apply to different statistical situations.
When you see x̄, think sample.
When you see μ, think population.
Once that distinction becomes second nature, formulas involving sampling, confidence intervals, hypothesis testing, normal distributions, and standard errors become much easier to understand.
And if you’re ever unsure, ask one simple question:
“Am I averaging a sample or the entire population?”
That answer usually tells you which mean symbol you need.
descover more post
Sample Mean Symbol Definition Formula How to Type It …

About Zoya
Zoya is the author and content creator behind DreamETrue, where she shares well-researched articles about dream meanings, dream symbolism, and interpretations from cultural, spiritual, and psychological perspectives.
Her goal is to make dream-related topics simple, trustworthy, and easy to understand for readers around the world. Every article is carefully written with a focus on clarity, accuracy, and providing genuine value, helping readers explore the fascinating world of dreams with confidence.
Through DreamETrue, Zoya is committed to publishing original, informative, and reader-focused content that follows high editorial standards. Whether you’re curious about a recurring dream or looking for the meaning behind a specific dream symbol, her mission is to provide reliable guidance in a clear and engaging way.
When she’s not researching dream symbolism, Zoya enjoys reading, learning about human psychology, and creating helpful content that inspires curiosity and understanding.