If you’ve ever studied statistics, probability, data science, economics, psychology, or research methods, you’ve likely come across the sample mean symbol. While it looks simple, many students and professionals confuse it with the population mean symbol or don’t know how to type it correctly.
Understanding the sample mean is essential because it’s one of the most frequently used concepts in statistics. It helps researchers estimate population averages, analyse data, test hypotheses, and make informed decisions from samples.
In this guide, you’ll learn exactly what the sample mean symbol is, what it represents, how to calculate it, how to type it on different devices, and how it differs from the population mean. You’ll also see practical examples, common mistakes, and answers to frequently asked questions.
Featured Snippet
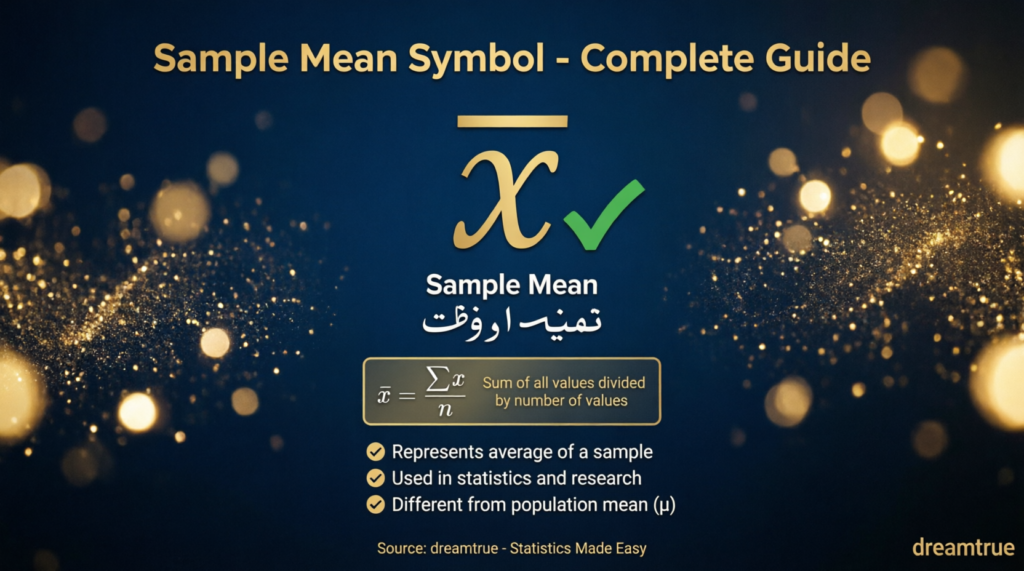
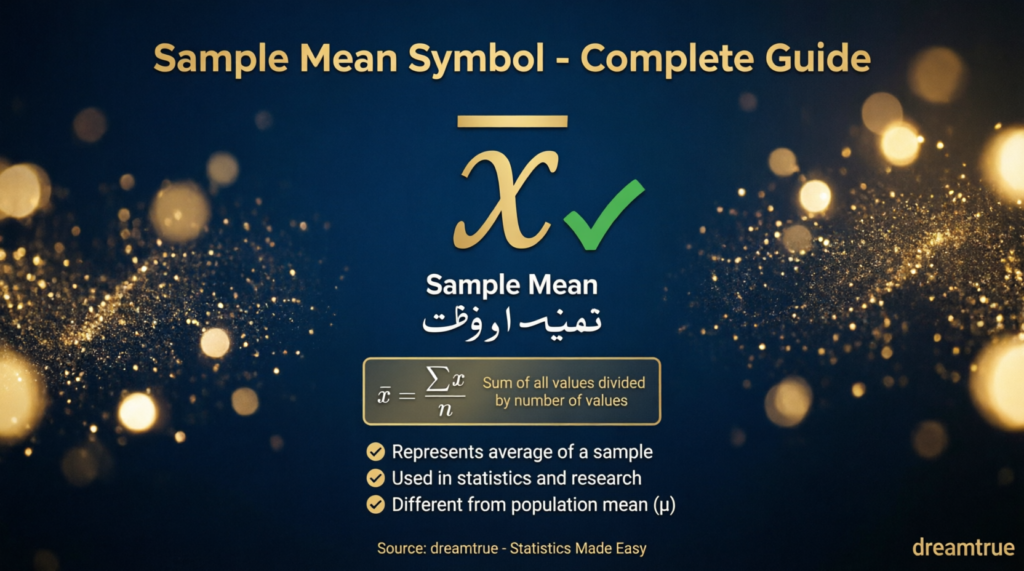
The sample mean symbol is x̄ (pronounced x-bar). It represents the average value calculated from a sample rather than an entire population. The sample mean is found by adding all sample values and dividing the total by the number of observations, making it one of the most important statistics in data analysis.
What Is the Sample Mean Symbol?
The sample mean symbol is:
x̄
It is pronounced:
“x-bar”
This symbol represents the average of a sample of observations.
A sample is only a portion of an entire population. Since measuring every member of a population is often impossible, statisticians calculate the sample mean to estimate the true population average.
For example:
Sample:
12, 15, 18, 20, 25
Sample mean:xˉ=18
Here, 18 represents the average value of the sample.
What Does x̄ Mean in Statistics?
The symbol x̄ represents:
- Average of sample data
- Arithmetic mean of a sample
- Point estimate of the population mean
- Centre of a sample distribution
It summarises an entire dataset using one number.
The larger and more representative the sample, the better x̄ estimates the population mean.
Sample Mean Formula
The formula for the sample mean is:xˉ=n∑x
Where:
| Symbol | Meaning |
|---|---|
| x̄ | Sample mean |
| Σx | Sum of all sample values |
| n | Sample size |
How to Calculate the Sample Mean
Follow these simple steps.
Step 1
Add every value.
Example:
10 + 14 + 16 + 20 + 25 = 85
Step 2
Count how many observations there are.
There are:
5 values
Step 3
Divide the total by the number of observations.85÷5=17
Therefore,
x̄ = 17
Sample Mean Calculation Example
Suppose a teacher records the marks of six students.
| Student | Marks |
|---|---|
| A | 72 |
| B | 75 |
| C | 80 |
| D | 82 |
| E | 90 |
| F | 95 |
Total:
72 + 75 + 80 + 82 + 90 + 95 = 494
Number of students:
6
Sample mean:xˉ=494/6=82.33
The average score is:
82.33
Sample Mean Symbol vs Population Mean Symbol
One of the biggest sources of confusion is mixing up these two symbols.
| Feature | Sample Mean | Population Mean |
|---|---|---|
| Symbol | x̄ | μ |
| Represents | Sample average | Entire population average |
| Calculated From | Sample | Whole population |
| Used For | Estimation | Actual population parameter |
| Known Value | Calculated from data | Often unknown |
Example
Population:
Every resident of a city.
Population mean:
μ
Sample:
500 randomly selected residents.
Sample mean:
x̄
Why Is the Sample Mean Important?
The sample mean is one of the foundations of statistics because it helps us:
- Estimate population averages
- Compare groups
- Perform hypothesis testing
- Build confidence intervals
- Calculate standard deviation
- Analyse survey results
- Make predictions from sample data
Without the sample mean, many statistical methods would not be possible.
Where Is the Sample Mean Used?
The sample mean appears in many fields.
Education
Calculating average examination scores.
Business
Finding average monthly sales.
Healthcare
Measuring average patient recovery time.
Finance
Calculating average investment returns.
Manufacturing
Monitoring product quality.
Data Science
Summarising datasets before analysis.
Psychology
Comparing participant responses.
How to Type the Sample Mean Symbol (x̄)
Because x̄ is a letter with a combining bar, typing it depends on the software you’re using.
| Platform | Method |
|---|---|
| Microsoft Word | Insert → Equation, then type \bar{x} |
| LaTeX | \bar{x} |
| Google Docs Equation | \bar{x} |
| HTML | x̄ or use a combining macron |
| Unicode | x + Combining Macron (U+0304) |
| Copy and Paste | x̄ |
The easiest option is simply to copy and paste:
x̄
Difference Between Mean, Median, and Mode
| Measure | Meaning | Sensitive to Outliers |
|---|---|---|
| Mean | Average | Yes |
| Median | Middle value | No |
| Mode | Most frequent value | No |
The sample mean is generally the preferred measure when data are roughly symmetric and free from extreme outliers.
Sample Mean vs Sample Median
| Sample Mean | Sample Median |
|---|---|
| Uses every value | Uses only the middle value |
| Affected by outliers | Resistant to outliers |
| Best for normal distributions | Better for skewed data |
Common Mistakes
Many beginners make these errors:
- Confusing x̄ with μ
- Forgetting to divide by the sample size
- Adding numbers incorrectly
- Ignoring missing observations
- Using the wrong sample size
- Assuming the sample mean always equals the population mean
Remember, the sample mean is an estimate, not necessarily the true population mean.
Sample Mean in Probability and Statistics
In probability theory, the sample mean is considered a random variable because it depends on which sample is selected.
As the sample size increases:
- The sample mean becomes more stable.
- It tends to move closer to the population mean.
- The sampling distribution of the mean becomes approximately normal under many common conditions (a key result of the Central Limit Theorem).
This is why larger, well-designed samples generally provide more reliable estimates.
Real-Life Example
Imagine a university wants to know the average height of all 20,000 students.
Measuring everyone would be time-consuming and expensive.
Instead, researchers randomly select 500 students.
The average height of those 500 students is:
x̄ = 171.6 cm
This sample mean is then used to estimate the average height of the entire student population.
Tips for Using the Sample Mean Correctly
- Use a representative sample.
- Increase sample size when practical.
- Check for outliers before relying on the mean.
- Report the sample size alongside the mean.
- Pair the mean with measures of variability (such as the standard deviation) for a fuller picture.
Frequently Asked Questions
What is the symbol for the sample mean?
The symbol is x̄ (x-bar).
Is x̄ the same as μ?
No. x̄ is the average of a sample, while μ represents the average of an entire population.
How do you pronounce x̄?
It is pronounced “x-bar.”
Why do statisticians use x̄ instead of μ?
Because researchers usually work with samples rather than measuring an entire population. The sample mean is used to estimate the unknown population mean.
Is the sample mean always equal to the population mean?
No. It is an estimate. With a representative sample and sufficient size, it is expected to be close to the population mean, but it will not always match exactly.
Can a sample have more than one mean?
No. A given sample has one arithmetic mean, although you can calculate other types of averages (such as weighted or geometric means) depending on the context.
Key Takeaways
| Topic | Summary |
|---|---|
| Sample mean symbol | x̄ (x-bar) |
| Represents | Average of a sample |
| Formula | x̄ = Σx / n |
| Population mean symbol | μ (mu) |
| Primary use | Estimating the population average |
| Common fields | Statistics, research, economics, finance, medicine, data science |
Conclusion
The sample mean symbol (x̄) is one of the most important symbols in statistics because it represents the average of a sample and serves as a practical estimate of a population mean. Whether you’re analysing survey data, evaluating exam scores, conducting scientific research, or building machine learning models, understanding x̄ is a fundamental skill.
By learning the formula, knowing how to calculate it accurately, and recognising the difference between x̄ and μ, you’ll have a solid foundation for more advanced statistical concepts such as confidence intervals, hypothesis testing, regression analysis, and inferential statistics.

About Zoya
Zoya is the author and content creator behind DreamETrue, where she shares well-researched articles about dream meanings, dream symbolism, and interpretations from cultural, spiritual, and psychological perspectives.
Her goal is to make dream-related topics simple, trustworthy, and easy to understand for readers around the world. Every article is carefully written with a focus on clarity, accuracy, and providing genuine value, helping readers explore the fascinating world of dreams with confidence.
Through DreamETrue, Zoya is committed to publishing original, informative, and reader-focused content that follows high editorial standards. Whether you’re curious about a recurring dream or looking for the meaning behind a specific dream symbol, her mission is to provide reliable guidance in a clear and engaging way.
When she’s not researching dream symbolism, Zoya enjoys reading, learning about human psychology, and creating helpful content that inspires curiosity and understanding.