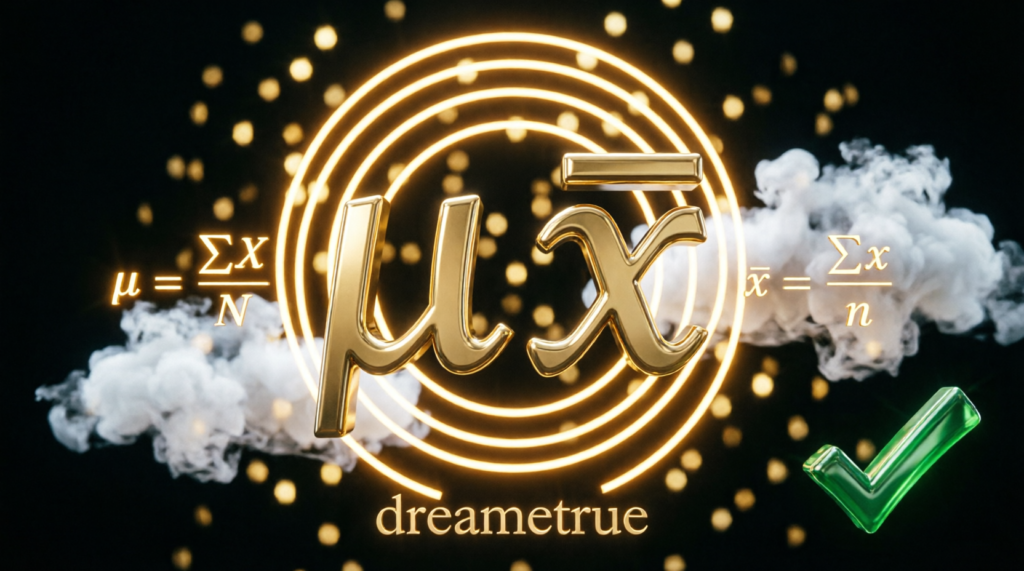
If you’re looking at a statistics problem and wondering, “What is the symbol for mean?”, you’re not alone. The notation can seem confusing at first because statistics uses different symbols depending on whether you’re describing a sample or an entire population.
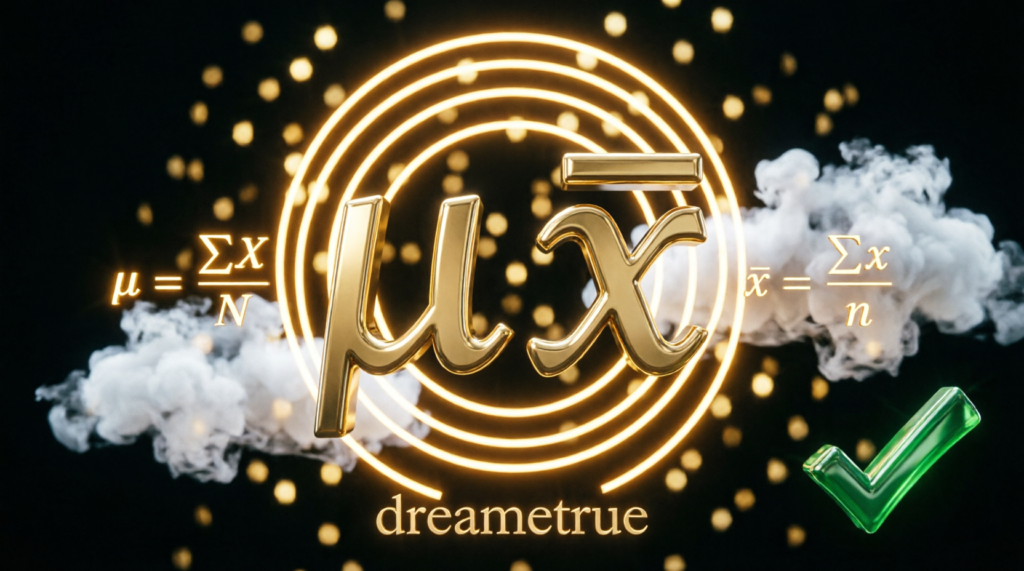
The good news is that the rule is simple: x̄ (x-bar) usually represents the sample mean, while μ (mu) represents the population mean. Once you understand that distinction, many statistics formulas become much easier to read.
Quick Answer: What Is the Symbol for Mean?
The symbol for the sample mean is x̄, pronounced “x-bar.” The symbol for the population mean is the Greek letter μ, pronounced “mu.” Both represent an arithmetic average, but x̄ describes a sample, while μ describes an entire population.
In short:
Sample mean = x̄
Population mean = μ
What Does the Mean Symbol Represent?
The mean is the arithmetic average of a group of numbers.
To calculate it, you add all the values together and divide the total by the number of values.
For example, suppose your data is:
10, 20, 30, 40, 50
The mean is:
(10 + 20 + 30 + 40 + 50) ÷ 5 = 30
So, the mean of this dataset is 30.
In statistics, however, the symbol you use for that mean depends on what your data represents.
x̄ vs. μ: What’s the Difference?
The two symbols you’ll encounter most often are x̄ and μ.
| Symbol | Name | Represents | Type |
|---|---|---|---|
| x̄ | x-bar | Mean of a sample | Statistic |
| μ | mu | Mean of a population | Parameter |
| Σ | Capital sigma | Summation/addition | Mathematical operator |
| n | n | Number of observations in a sample | Sample size |
| N | N | Number of observations in a population | Population size |
This distinction is fundamental in statistics. OpenStax and Penn State both identify x̄ as the sample mean and μ as the population mean.
The easiest way to remember it
Think:
x̄ = sample
μ = population
A sample is only part of a larger population, while a population contains the complete group being studied.
What Is the Symbol for the Sample Mean?
The standard symbol for the sample mean is:
x̄
It is pronounced:
“x-bar.”
The bar placed above the letter x is what makes the notation different from an ordinary x.
The sample mean is calculated using:
[
\bar{x}=\frac{\sum x_i}{n}
]
Where:
- x̄ = sample mean
- Σ = sum of
- xᵢ = individual observations
- n = number of observations in the sample
OpenStax gives the sample-mean formula as ( \bar{x} = \frac{1}{n}\sum x_i ).
Sample mean example
Imagine you randomly select five students and record their test scores:
70, 75, 80, 85, 90
Add the scores:
70 + 75 + 80 + 85 + 90 = 400
There are five scores, so:
[
\bar{x}=\frac{400}{5}=80
]
Therefore:
x̄ = 80
Because these five students represent a sample, the mean is written as x̄.
What Is the Symbol for the Population Mean?
The standard symbol for the population mean is:
μ
This is the Greek letter mu.
It is pronounced approximately like “myoo” or “mew.”
The population mean describes the average of every member of the population being studied.
Its formula is:
[
\mu=\frac{\sum X}{N}
]
Where:
- μ = population mean
- Σ = sum of
- X = population values
- N = total population size
Both OpenStax and Penn State use μ for the population mean.
Population mean example
Suppose a small company has exactly five employees, and you want the average age of all five employees.
Their ages are:
20, 25, 30, 35, 40
Add them:
20 + 25 + 30 + 35 + 40 = 150
Divide by the population size:
[
\mu=\frac{150}{5}=30
]
Therefore:
μ = 30
Because you included every member of the population, the correct symbol is μ, not x̄.
Why Are There Two Symbols for the Mean?
This is one of the most common points of confusion for beginners.
You might reasonably ask:
“If both x̄ and μ mean average, why not just use one symbol?”
The answer is that statistics needs to distinguish between a sample and a population.
Suppose a country has millions of people. You probably can’t measure every person’s income, height, age, or spending habits.
Instead, researchers select a sample.
The average calculated from that sample is x̄.
The actual average for the entire population is μ.
The sample mean can then be used to estimate the population mean.
Think of it this way
Population → μ
Sample → x̄
That simple distinction will help you understand much of introductory statistics.
Sample Mean vs. Population Mean
Here’s the difference at a glance:
| Feature | Sample Mean | Population Mean |
|---|---|---|
| Symbol | x̄ | μ |
| Pronunciation | x-bar | mu |
| Describes | A sample | Entire population |
| Classification | Statistic | Parameter |
| Typical size notation | n | N |
| Formula | x̄ = Σxᵢ/n | μ = ΣX/N |
| Common purpose | Estimate population characteristics | Describe the actual population |
A statistic describes a sample, while a parameter describes a population. This terminology is important when moving from descriptive statistics into inferential statistics.
What Is the Formula for the Mean?
The basic arithmetic mean follows the same idea whether you’re calculating a sample mean or population mean:
Add all values and divide by how many values there are.
For a sample:
[
\bar{x}=\frac{x_1+x_2+x_3+\cdots+x_n}{n}
]
For a population:
[
\mu=\frac{X_1+X_2+X_3+\cdots+X_N}{N}
]
The mathematical structure is essentially the same. What changes is the scope of the data and therefore the notation used to describe the result.
What Does the Bar Over x Mean?
The horizontal line above the x in x̄ is called a bar.
So:
x̄ = x-bar
The bar tells you that you’re dealing with an average of x values rather than one individual observation.
For example:
- x₁ = first observation
- x₂ = second observation
- x₃ = third observation
- x̄ = average of the observations
That’s why the notation is so useful.
Instead of writing “the average of all the sample x values” every time, statisticians can simply write x̄.
What Does μ Mean in Statistics?
The symbol μ is the Greek letter mu.
In statistics, it commonly represents the population mean.
For example:
[
\mu=75
]
means the population mean is 75.
You’ll encounter μ frequently in topics such as:
- Probability
- Inferential statistics
- Hypothesis testing
- Confidence intervals
- Normal distributions
- Sampling distributions
- Statistical estimation
It is therefore important to recognize μ quickly when reading statistical formulas.
What Does Σ Mean in the Mean Formula?
Another symbol you’ll frequently see alongside the mean is:
Σ
This is the uppercase Greek letter sigma, and in mathematics it represents summation.
For example:
[
\sum x_i
]
means:
Add all the x values together.
So when you see:
[
\bar{x}=\frac{\sum x_i}{n}
]
you can translate it into plain English as:
“Add all the sample values and divide by the number of sample values.”
OpenStax specifically describes Σ as the summation notation used in the mean formulas.
How Do You Calculate a Sample Mean?
Calculating a sample mean is straightforward.
Step 1: List the values
Suppose your sample is:
5, 10, 15, 20
Step 2: Add the values
[
5+10+15+20=50
]
Step 3: Count the values
There are 4 observations.
So:
n = 4
Step 4: Divide
[
\bar{x}=\frac{50}{4}=12.5
]
Therefore:
x̄ = 12.5
This is the sample mean.
How Do You Calculate a Population Mean?
The process is almost identical.
Suppose the complete population contains:
2, 4, 6, 8, 10
Add them:
[
2+4+6+8+10=30
]
There are five members:
N = 5
Therefore:
[
\mu=\frac{30}{5}=6
]
So:
μ = 6
Because the calculation includes the entire population, the result is the population mean.
Why Is the Sample Mean Important?
In real-world research, measuring an entire population is often expensive, time-consuming, or impossible.
For example, suppose researchers want to estimate the average height of adults in a country.
They could theoretically measure every adult, but that’s impractical.
Instead, they can select a properly designed sample and calculate x̄.
The sample mean can then provide information about the unknown population mean μ.
This is one of the foundations of inferential statistics.
Is the Mean the Same as the Average?
In everyday conversation, mean and average are often used interchangeably.
In statistics, however, “mean” can be more precise.
The arithmetic mean is calculated by adding values and dividing by the number of values.
OpenStax notes that “average” is commonly used to refer to the arithmetic mean in everyday practice, even though the terminology can be more technically nuanced.
So if someone asks:
“What is the average?”
They may be asking for the arithmetic mean.
Mean vs. Median vs. Mode
Don’t confuse the mean symbol with the symbols or concepts used for other measures of central tendency.
| Measure | What it tells you |
|---|---|
| Mean | Arithmetic average |
| Median | Middle value after ordering the data |
| Mode | Most frequently occurring value |
For example, consider:
2, 3, 3, 5, 7
Mean
[
\frac{2+3+3+5+7}{5}=4
]
Median
The middle value is:
3
Mode
The most frequent value is:
3
So the three measures aren’t necessarily the same.
The mean is only one way of describing the center of a dataset.
Common Mistakes With the Mean Symbol
Mistake 1: Thinking μ always means “mean”
The symbol μ specifically represents the population mean in standard statistical notation.
The sample mean is normally written as x̄.
Mistake 2: Thinking x̄ represents the entire population
Usually, x̄ refers to a sample mean.
If you’re describing the entire population, μ is the conventional symbol.
Mistake 3: Confusing Σ with the mean
Σ doesn’t mean “mean.”
It means summation.
Mistake 4: Dividing by the wrong number
For a sample mean, divide by the sample size n.
For a population mean, divide by the population size N.
Mistake 5: Confusing x with x̄
These aren’t the same.
x can represent an individual value or variable.
x̄ represents the average of the sample’s x values.
How to Remember x̄ and μ Easily
If you’re studying for a statistics exam, use this memory trick:
x̄ = sample average
μ = population average
You can also remember:
n → sample
N → population
That gives you the two standard formulas:
[
\boxed{\bar{x}=\frac{\sum x_i}{n}}
]
and
[
\boxed{\mu=\frac{\sum X_i}{N}}
]
Once you’ve memorized those four pieces — x̄, μ, n, and N — many introductory statistics questions become much easier.
How to Type the Mean Symbol
If you need to type these symbols in a document, spreadsheet, assignment, or website, there are several options.
Copy and paste
Sample mean:
x̄
Population mean:
μ
Summation:
Σ
In mathematical notation
You can write:
[
\bar{x}
]
for x-bar and:
[
\mu
]
for mu.
In applications such as Microsoft Word, Google Docs, LaTeX, and statistical software, mathematical notation can also be entered using the application’s equation tools.
Mean Symbol in Statistics: Quick Reference
| Question | Answer |
|---|---|
| What is the symbol for mean? | x̄ for a sample; μ for a population |
| What is x̄ called? | x-bar |
| What is μ called? | mu |
| What does x̄ represent? | Sample mean |
| What does μ represent? | Population mean |
| What is the sample mean formula? | x̄ = Σxᵢ/n |
| What is the population mean formula? | μ = ΣXᵢ/N |
| What does Σ mean? | Summation |
| What does n mean? | Sample size |
| What does N mean? | Population size |
| Is x̄ a statistic? | Yes |
| Is μ a parameter? | Yes |
This notation is consistent with standard introductory statistics references from OpenStax and Penn State.
Frequently Asked Questions
What is the symbol for mean?
The symbol depends on whether you’re talking about a sample or population. x̄ (x-bar) represents the sample mean, while μ (mu) represents the population mean.
What is the symbol for the sample mean?
The standard symbol is x̄, pronounced x-bar.
What is the symbol for the population mean?
The standard symbol is μ, the Greek letter mu.
Is the mean symbol x̄ or μ?
Both can represent a mean, but they are used in different contexts. x̄ is used for the sample mean, whereas μ is used for the population mean.
What is x-bar in statistics?
x-bar (x̄) is the arithmetic mean calculated from a sample of observations.
What does mu mean in statistics?
μ (mu) normally represents the true mean of a statistical population.
What is the difference between x and x̄?
x can represent an individual observation or variable, while x̄ represents the average of the sample’s observations.
What does sigma mean in the mean formula?
The capital Greek letter Σ means that you should add the specified values together.
Is the mean the same as the average?
In common usage, yes. “Average” is frequently used to mean the arithmetic mean, although statistics uses more precise terminology when necessary.
What is the symbol for mean in math?
For an arithmetic mean, x̄ is commonly used for a sample and μ for a population. The exact notation can vary by mathematical context, so it’s important to check how the symbols are defined in a particular problem.
What symbol represents the mean of a sample?
The conventional symbol is:
x̄
What symbol represents the mean of a population?
The conventional symbol is:
μ
Final Takeaway
If you only remember one thing from this article, remember this:
x̄ = sample mean
μ = population mean
The mean itself is simply an arithmetic average: add the values and divide by the number of values.
The important statistical distinction is whose average you’re describing. If you’re working with a sample, use x̄. If you’re describing the entire population, use μ.
Once you understand that difference, symbols such as Σ, n, and N become much easier to interpret, and formulas that initially look intimidating start to read almost like ordinary English.
descover more post
What Does the Infinity Symbol Mean ∞ Meaning History …
What Does the Symbol Mean in Yellowjackets Theories …
What Does the Berserk Symbol Mean The Brand of …

Zayan is the creator and lead writer at DreamETrue, a blog dedicated to exploring the fascinating world of dreams and their meanings. With a passion for dream symbolism, spiritual insights, and easy-to-understand explanations, Zayan creates well-researched content that helps readers better understand the messages and emotions behind their dreams.
Every article published on DreamETrue is written with a focus on accuracy, clarity, and reader value. By combining information from trusted sources, cultural perspectives, and psychological interpretations, Zayan aims to make dream-related topics simple, engaging, and accessible for everyone.
Whether you’re curious about a recurring dream, searching for the meaning of a specific symbol, or simply interested in learning more about dreams, Zayan’s goal is to provide helpful, reliable, and easy-to-read content that informs and inspires.