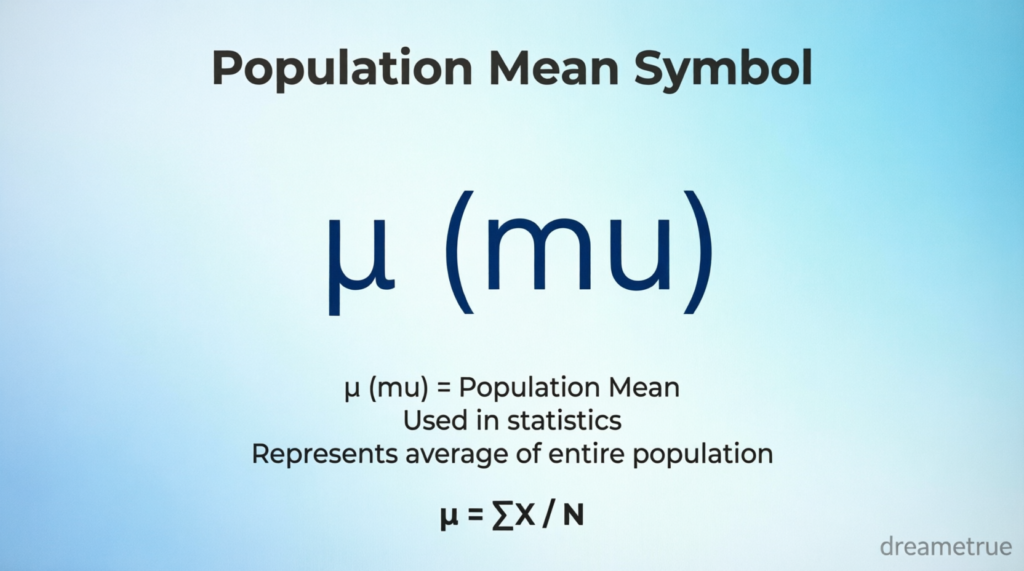
Statistics is full of symbols, and one of the most important is the population mean symbol. Whether you’re studying statistics, conducting research, analysing data, or preparing for an exam, understanding this symbol is essential. It represents the average value of an entire population rather than just a sample.
In this guide, you’ll learn what the population mean symbol is, why it matters, how it’s calculated, when it’s used, how it differs from the sample mean, and the common mistakes people make. By the end, you’ll have a clear understanding of one of the most fundamental concepts in statistics.
Featured Snippet
The population mean symbol is μ (the Greek letter mu). It represents the average value of every member of an entire population. The population mean is calculated by adding all population values and dividing by the total number of observations, N. It is different from the sample mean, which is represented by x̄ (x-bar).
What Is the Population Mean Symbol?
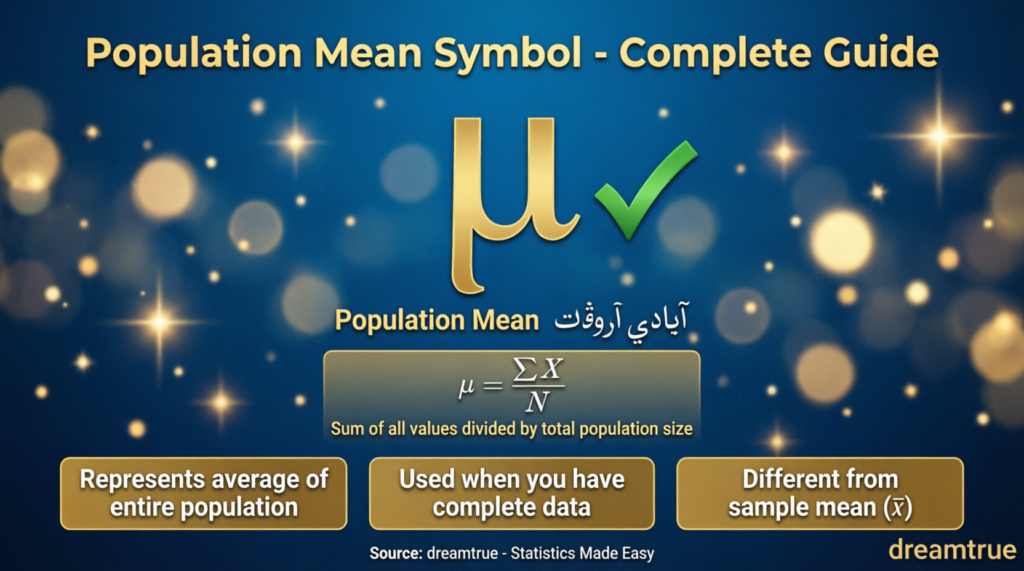
The population mean symbol is the Greek letter
μ (Mu)
In statistics, μ represents the true average of an entire population.
A population includes every individual, object, or measurement you’re interested in studying.
For example:
- The average height of every student in a school
- The average annual income of all households in a country
- The average lifespan of every battery produced in a factory
When every value in the population is included, the resulting average is the population mean (μ).
Why Is the Population Mean Important?
The population mean acts as the benchmark for statistical analysis.
Researchers compare sample data with the population mean to determine whether differences are meaningful.
It helps in:
- Statistical research
- Data analysis
- Machine learning
- Business analytics
- Economics
- Healthcare research
- Psychology
- Manufacturing quality control
Without the population mean, many statistical methods would not exist.
Population Mean Symbol (μ)
| Symbol | Name | Meaning |
|---|---|---|
| μ | Mu | Population mean (true average) |
The symbol comes from the Greek alphabet and has been used in statistics for decades.
Population Mean Formula
The population mean is calculated using this formula:μ=N∑X
Where:
| Symbol | Meaning |
|---|---|
| μ | Population mean |
| Σ | Sum of all values |
| X | Individual value |
| N | Total population size |
How to Calculate the Population Mean
Follow these simple steps:
Step 1: Add Every Population Value
Example population:
12, 18, 20, 25, 30
Total:
12 + 18 + 20 + 25 + 30 = 105
Step 2: Count the Number of Values
There are:
5 observations
Step 3: Divide the Total by the Number of Values
μ=5105=21
Therefore,
Population Mean (μ) = 21
Real-Life Examples
Example 1: Classroom Marks
Suppose every student’s score is:
80, 85, 90, 75, 70
Average:μ=5400=80
Population mean = 80
Example 2: Monthly Sales
Sales (£):
5000, 5500, 6200, 4800
Total:
21,500
Population size:
4
Population mean:
£5,375
Example 3: Employee Ages
Ages:
24, 26, 29, 31, 40
Population mean:
30 years
Population Mean vs Sample Mean
Many students confuse these two concepts.
| Feature | Population Mean | Sample Mean |
|---|---|---|
| Symbol | μ | x̄ |
| Data Used | Entire population | Sample only |
| Accuracy | True average | Estimate of the population average |
| Population Size | N | n |
| Purpose | Describes the whole population | Estimates μ |
Example
Imagine a university has 20,000 students.
- Average GPA of all 20,000 students → Population Mean (μ)
- Average GPA of 300 selected students → Sample Mean (x̄)
Population Mean Symbol vs Other Statistical Symbols
| Symbol | Name | Meaning |
|---|---|---|
| μ | Population Mean | Average of entire population |
| x̄ | Sample Mean | Average of a sample |
| σ | Population Standard Deviation | Spread of population data |
| s | Sample Standard Deviation | Spread of sample data |
| N | Population Size | Total observations |
| n | Sample Size | Number of sampled observations |
| Σ | Summation | Adds all values |
Understanding these symbols makes statistical formulas much easier to interpret.
When Is the Population Mean Used?
The population mean is used whenever data from the entire population is available.
Common applications include:
- National census analysis
- Government statistics
- Clinical research
- Manufacturing inspections
- Financial reporting
- Educational performance analysis
- Market research
- Scientific experiments
Why Researchers Often Use the Sample Mean Instead
In real life, studying every member of a population is often impractical because it can be:
- Expensive
- Time-consuming
- Logistically difficult
- Impossible for very large populations
Instead, researchers collect a representative sample and use x̄ to estimate μ through statistical inference.
Difference Between Population and Sample
| Population | Sample |
|---|---|
| Entire group | Small subset |
| Uses μ | Uses x̄ |
| Uses N | Uses n |
| True values | Estimated values |
| Often difficult to collect | Easier and cheaper |
Common Mistakes
Avoid these frequent errors:
- Confusing μ with x̄
- Using n instead of N
- Forgetting to include every population value
- Mixing population formulas with sample formulas
- Assuming a sample mean is always equal to the population mean
Advantages of Using the Population Mean
The population mean provides several benefits:
- Represents the true average
- No sampling error
- More accurate than sample estimates
- Easy to interpret
- Forms the basis of many statistical analyses
Limitations
Despite its usefulness, the population mean has some limitations:
- Requires complete population data
- Can be expensive to calculate for large populations
- Sensitive to extreme values (outliers)
- Often unavailable in real-world research
Population Mean in Different Fields
Education
Used to determine the average performance of all students in a school or district.
Business
Measures average sales, profits, customer satisfaction, or production output.
Healthcare
Calculates average blood pressure, recovery times, or treatment outcomes across an entire patient population.
Economics
Measures average income, inflation-related indicators, or household spending.
Engineering
Helps assess average product quality and manufacturing consistency.
Data Science
Serves as a foundational statistic for data preprocessing, model evaluation, and performance analysis.
Tips for Remembering the Population Mean Symbol
A few memory tricks can help:
- μ (Mu) = Mean of the Population
- Greek letters are commonly used for population parameters.
- x̄ (x-bar) is reserved for sample means.
- N refers to the total population, while n refers to a sample.
Frequently Asked Questions
What is the symbol for the population mean?
The symbol is μ (Greek letter mu).
What is the difference between μ and x̄?
μ represents the average of an entire population, while x̄ represents the average of a sample.
How do you calculate the population mean?
Add all population values together and divide by the total number of observations:
μ = ΣX / N
Is μ always known?
No. In many real-world situations, the true population mean is unknown because collecting data from every member of the population is impractical. Researchers typically estimate it using a sample.
Why is μ written as a Greek letter?
Greek letters are a long-standing convention in mathematics and statistics for representing population parameters, while Roman letters often represent sample statistics.
Can the population mean change?
Yes. If the population itself changes—for example, if new members are added or existing values change—the population mean will also change.
Key Takeaways
| Concept | Summary |
|---|---|
| Population Mean Symbol | μ (Mu) |
| Represents | Average of the entire population |
| Formula | μ = ΣX / N |
| Population Size Symbol | N |
| Sample Mean Symbol | x̄ |
| Used In | Statistics, research, business, science, healthcare, economics, and data analysis |
Conclusion
The population mean symbol (μ) is one of the most important concepts in statistics. It represents the true average of every value in a population and serves as the foundation for descriptive statistics and statistical inference. Understanding how μ differs from the sample mean (x̄), how to calculate it, and where it’s used will make it much easier to interpret statistical data accurately.
Whether you’re a student learning statistics, a researcher analysing data, or a professional working with analytics, mastering the population mean symbol is a small step that unlocks a much deeper understanding of statistical reasoning.
descover more post
Symbol for Mean x̄, μ, and More Complete Guide …
Mean Symbol in Statistics x̄, μ, Formulas Examples and …

About Zoya
Zoya is the author and content creator behind DreamETrue, where she shares well-researched articles about dream meanings, dream symbolism, and interpretations from cultural, spiritual, and psychological perspectives.
Her goal is to make dream-related topics simple, trustworthy, and easy to understand for readers around the world. Every article is carefully written with a focus on clarity, accuracy, and providing genuine value, helping readers explore the fascinating world of dreams with confidence.
Through DreamETrue, Zoya is committed to publishing original, informative, and reader-focused content that follows high editorial standards. Whether you’re curious about a recurring dream or looking for the meaning behind a specific dream symbol, her mission is to provide reliable guidance in a clear and engaging way.
When she’s not researching dream symbolism, Zoya enjoys reading, learning about human psychology, and creating helpful content that inspires curiosity and understanding.