If you’ve ever looked at a statistics formula and wondered, “What is the symbol for population mean?”, the answer is μ (mu).
That small Greek letter appears everywhere in statistics. You may see it in formulas for averages, probability distributions, confidence intervals, hypothesis tests, and statistical inference. But μ isn’t simply another way to write “average.” It specifically represents the mean of an entire population.
The important part is knowing when to use μ, when to use x̄ (x-bar), and what the other symbols around them actually mean.
This guide explains the population mean symbol from the ground up, including its definition, formula, examples, pronunciation, difference from the sample mean, and the common mistakes students make.
Featured Snippet: What Is the Symbol for Population Mean?
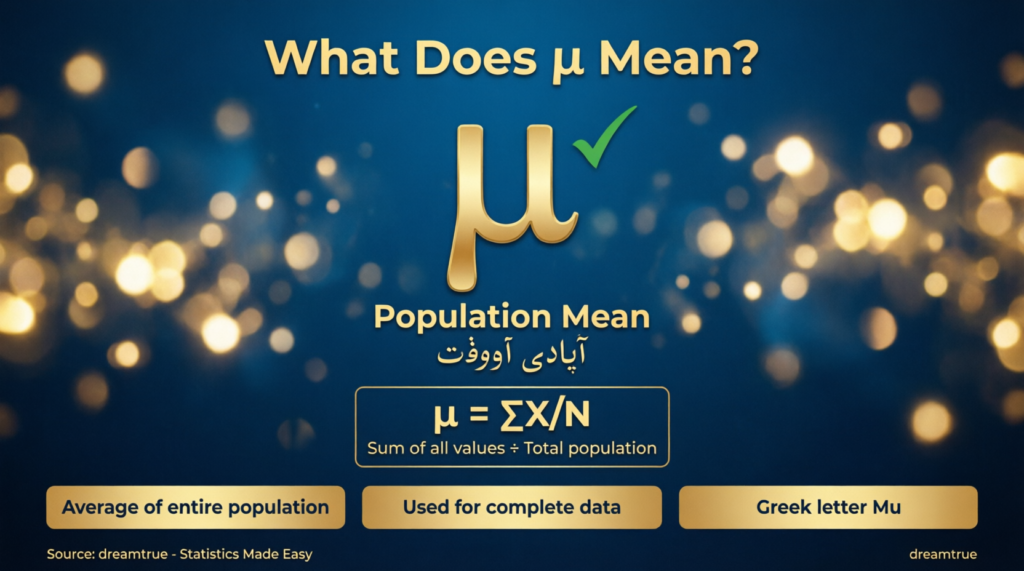
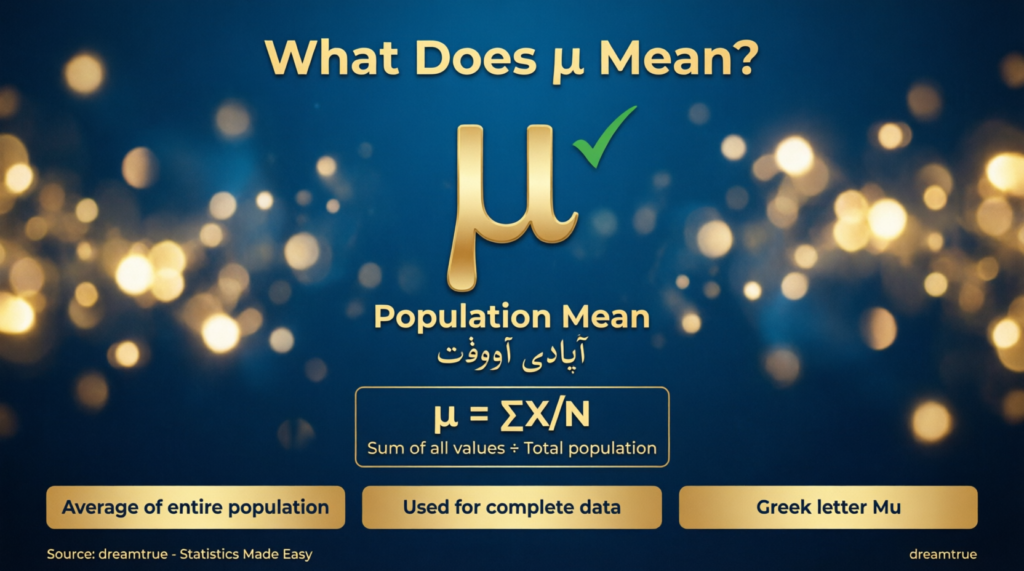
The symbol for population mean is μ (Greek lowercase mu). It represents the arithmetic average of every value in a statistical population. The population mean is calculated as μ = Σx / N, where Σx is the sum of all population values and N is the population size.
What Is the Symbol for Population Mean?
The standard symbol for the population mean is:
μ
It is the lowercase Greek letter mu, pronounced like “myoo”.
In statistics, μ represents the population mean, meaning the average value calculated from all members of the population being studied.
For example, suppose a school has exactly 500 students and you record the test score of every student. If you add all 500 scores and divide by 500, the resulting average is the population mean, represented by μ.
In simple terms:
μ = population mean = average of the entire population
This distinction matters because statistics often deals with a population that is too large, expensive, or impractical to measure completely.
What Does μ Mean in Statistics?
In statistics, μ is a population parameter.
A parameter is a numerical value that describes an entire population. The population mean is one such parameter.
For example, imagine you’re studying the average height of every student in a university.
- Population: Every student at the university
- Variable: Student height
- μ: The true average height of all students
If you could measure every student and calculate the exact average, that value would be μ.
In real research, however, measuring an entire population is often impractical. Researchers therefore select a sample and use its average to estimate μ.
Population Mean Symbol at a Glance
| Concept | Symbol | Meaning |
|---|---|---|
| Population mean | μ | Average of the entire population |
| Sample mean | x̄ | Average of a sample |
| Population size | N | Number of values in the population |
| Sample size | n | Number of values in the sample |
| Population standard deviation | σ | Spread of population values |
| Sample standard deviation | s | Spread estimated from a sample |
| Summation | Σ | Add a specified set of values |
This notation is widely used in introductory statistics and statistical research.
What Is the Population Mean?
The population mean is the arithmetic average of all values in a population.
To calculate it, add every value in the population and divide the total by the number of values.
The basic formula is:
μ = Σx / N
Where:
- μ = population mean
- Σ = sum of
- x = individual population value
- N = total number of values in the population
The same formula can also be written as:
μ = (x₁ + x₂ + x₃ + … + xₙ) / N
The notation used in the formula may vary depending on the textbook, but the basic idea remains the same.
How to Calculate the Population Mean
Calculating a population mean is straightforward when you have data for every member of the population.
Step 1: Add all values
Suppose the population contains five numbers:
10, 20, 30, 40, 50
Add them:
10 + 20 + 30 + 40 + 50 = 150
Step 2: Count the values
There are five values, so:
N = 5
Step 3: Divide the sum by the population size
μ = 150 / 5
μ = 30
Therefore:
Population mean = μ = 30
The population’s average value is 30.
Population Mean Formula Explained
The formula:
μ = Σx / N
can look intimidating at first, but each part has a simple job.
μ — Population Mean
The Greek letter mu represents the average of the entire population.
Σ — Summation
The capital Greek letter sigma (Σ) means “add everything specified.”
So:
Σx
means to add all the relevant x values.
x — Individual Value
The letter x represents an individual observation or data value.
For example, if you’re studying test scores, each x could represent one student’s score.
N — Population Size
N represents the total number of observations in the population.
So if you have data from 1,000 people:
N = 1,000
Population Mean vs. Sample Mean
This is one of the most important distinctions in statistics.
The population mean is represented by μ, while the sample mean is commonly represented by x̄, pronounced “x-bar.”
| Feature | Population Mean | Sample Mean |
|---|---|---|
| Symbol | μ | x̄ |
| Pronunciation | mu | x-bar |
| Describes | Entire population | Sample |
| Type | Parameter | Statistic |
| Typical size notation | N | n |
| Formula | μ = Σx/N | x̄ = Σx/n |
| Main purpose | Describe population | Estimate population mean |
The easiest way to remember it
Think:
μ → population
x̄ → sample
The Greek letter μ is conventionally used for a population parameter, while x̄ is used for the sample mean.
Why Do We Use μ for the Population Mean?
The use of Greek letters for population parameters is a common statistical convention.
For example:
- μ = population mean
- σ = population standard deviation
- ρ = population correlation
- π may be used for a population proportion in some notation systems
Sample statistics often use Roman letters or related notation, such as:
- x̄ = sample mean
- s = sample standard deviation
- r = sample correlation
- p̂ = sample proportion
This system makes it easier to distinguish an unknown population parameter from a value calculated from observed sample data.
It’s not that μ is inherently “the average symbol” in every area of mathematics. Its meaning depends on context. In statistics, μ is conventionally used for the population mean.
Population Mean Example in Real Life
Imagine a company has exactly 100 employees and wants to know the average number of hours employees work each week.
If the company collects the weekly hours of all 100 employees, it has complete population data.
Suppose the total is:
4,000 hours
The population size is:
N = 100
Therefore:
μ = 4,000 / 100
μ = 40 hours
The population mean is 40 hours per week.
Because every employee was included, 40 is the actual population mean rather than an estimate based on a sample.
What If You Don’t Have the Whole Population?
This is where the distinction between μ and x̄ becomes especially important.
Suppose a university has 20,000 students. You want to know their average daily study time.
Measuring all 20,000 students might be difficult.
Instead, you select 200 students and calculate their average.
That average is:
x̄
It is the sample mean.
The true average for all 20,000 students is:
μ
If the sample is appropriately selected, researchers can use x̄ to estimate μ. NIST explains that the sample mean is commonly used as a point estimate of the population mean.
The relationship is:
Sample → x̄ → estimate → Population mean μ
This is one of the foundations of statistical inference.
Why Is the Population Mean Often Unknown?
The population mean may be a perfectly defined value even when nobody knows what it is.
For example, suppose you want the exact average income of every person in a huge population.
The population mean exists mathematically, but collecting accurate income information from every individual may be unrealistic.
Statistics solves this problem by using samples.
Researchers calculate a sample mean and use it to make inferences about the unknown population mean. Different samples can produce different sample means, which is why statistical estimation also considers uncertainty.
Population Mean and Sample Mean Formula
The formulas look almost identical:
Population mean
μ = Σx / N
Sample mean
x̄ = Σx / n
The main difference is what the symbols describe.
N refers to the entire population.
n refers to the sample.
So the calculation itself is essentially the same: add the observations and divide by how many observations you have.
The statistical meaning is different because one describes the entire population while the other describes a sample.
What Is the Difference Between μ and x̄?
The simplest distinction is:
μ is the true population mean; x̄ is the mean calculated from a sample.
Consider a country with millions of residents.
If you somehow obtained the relevant measurement for every person, their average would be μ.
If you surveyed 2,000 people and calculated their average, that value would be x̄.
The sample mean is often used to estimate the population mean.
Quick memory trick
μ = whole population
x̄ = sample
If you remember just one thing from this article, remember that distinction.
Is μ the Same as “Average”?
Not always.
In everyday language, people frequently use average to mean the arithmetic mean.
In statistics, however, “average” can be ambiguous.
It might refer to:
- Mean
- Median
- Mode
- Weighted mean
- Geometric mean
- Harmonic mean
When statisticians write μ, they are specifically referring to the population mean under the notation convention being used.
The mean itself is the numerical average obtained by adding the values and dividing by their count.
Population Mean vs. Median vs. Mode
The mean isn’t the only way to describe the center of a dataset.
| Measure | Basic idea | Common notation |
|---|---|---|
| Mean | Sum divided by number of values | μ for population |
| Median | Middle value after ordering | Varies |
| Mode | Most frequent value | Varies |
For example, consider:
2, 3, 3, 4, 18
The mean is:
30 / 5 = 6
The median is:
3
The mode is:
3
These three measures describe the dataset differently.
So when you see μ, don’t confuse it with a generic symbol for “central value.” It specifically refers to the population mean.
What Is the Population Mean in Probability?
In probability and statistics, μ can also represent the expected value or mean of a random variable under appropriate conditions.
For a random variable X, you may see:
μ = E(X)
For a discrete random variable, the expected value can be written as a weighted sum of possible values and their probabilities.
The important idea is that the mean represents the long-run or probability-weighted average associated with the distribution.
This connects population mean notation to probability distributions and statistical modeling.
Population Mean and Normal Distribution
If you’ve studied the normal distribution, you’ve probably seen both μ and σ.
In a normal distribution:
- μ represents the population mean.
- σ represents the population standard deviation.
The mean determines the center of the distribution, while the standard deviation describes its spread.
This is why a normal distribution is often described using its two parameters:
N(μ, σ²)
where μ is the mean and σ² is the population variance.
Don’t confuse μ and σ
A common beginner mistake is mixing them up.
μ → mean
σ → standard deviation
A useful memory trick is:
Mu = Mean
Sigma = Spread
Population Mean in Hypothesis Testing
The population mean also plays an important role in hypothesis testing.
A hypothesis test may ask whether a population mean is equal to a particular value.
For example:
H₀: μ = 50
This means the null hypothesis states that the population mean is 50.
An alternative hypothesis might be:
H₁: μ ≠ 50
The researcher then uses sample data to evaluate evidence about the population parameter μ.
The exact test depends on the study design, assumptions, sample size, and whether the population standard deviation is known.
Population Mean in Confidence Intervals
A confidence interval can be used to estimate an unknown population mean.
Instead of reporting only a single estimate, researchers can report an interval based on sample data.
For example, a study might estimate that the population mean is around a particular value and provide a confidence interval around that estimate.
The important distinction is:
x̄ is calculated from the sample.
μ is the population parameter being estimated.
NIST describes interval estimation as a way of incorporating uncertainty around a point estimate of a population parameter.
Common Symbols Related to the Population Mean
Once you understand μ, several other statistical symbols become easier to recognize.
| Symbol | Name | Meaning |
|---|---|---|
| μ | Mu | Population mean |
| x̄ | X-bar | Sample mean |
| σ | Sigma | Population standard deviation |
| s | s | Sample standard deviation |
| N | Capital N | Population size |
| n | Lowercase n | Sample size |
| Σ | Capital sigma | Summation |
| p | Population proportion | Population proportion in common notation |
| p̂ | p-hat | Sample proportion |
OpenStax similarly distinguishes population and sample notation for means, variances, and standard deviations.
What Does the Greek Letter μ Mean?
The symbol μ is the lowercase Greek letter mu.
In statistics, it is commonly used for the population mean.
However, μ does not universally mean population mean in every mathematical context.
Symbols can have different meanings depending on the field and context.
For example, μ may appear in physics, engineering, mathematics, probability, and other disciplines with different definitions.
So don’t assume that every μ you see means population mean.
Context determines meaning.
How Do You Pronounce μ?
The symbol μ is pronounced:
“mu”
In English, it is commonly pronounced approximately like:
“myoo”
So you might read:
μ = 25
as:
“mu equals twenty-five.”
You may also hear someone say:
“the population mean is mu.”
How Do You Type the Population Mean Symbol μ?
If you need to copy the symbol, here it is:
μ
You can copy and paste it directly.
On Windows
Depending on the application, you can insert Greek symbols through the application’s symbol or equation tools. In Microsoft Word, for example, mathematical notation can be inserted through its equation functionality.
In LaTeX
Use:
\mu
which renders as:
μ
In HTML
You can use the appropriate Greek-letter entity or Unicode character.
Important Unicode detail
The character μ and the visually similar µ can be technically different Unicode characters.
Unicode identifies μ as GREEK SMALL LETTER MU (U+03BC) and µ as MICRO SIGN (U+00B5). They can look almost identical, but they aren’t the same encoded character. Unicode documentation recommends the Greek small letter mu in mathematical contexts.
For statistics, the character normally intended is:
μ
Is the Population Mean Symbol μ or x̄?
The correct answer depends on whether you’re talking about the population or a sample.
Population mean:
μ
Sample mean:
x̄
This is a very common exam question.
If a question asks:
“Which symbol represents the population mean?”
The answer is:
μ
If it asks:
“Which symbol represents the sample mean?”
The expected answer is generally:
x̄
Both symbols represent means, but they refer to different statistical objects.
Why Is x̄ Used for the Sample Mean?
The bar over x indicates an average.
So:
x̄
is read as “x-bar.”
It represents the arithmetic mean of the observed sample values.
For example, if a sample contains:
5, 10, 15
then:
x̄ = (5 + 10 + 15) / 3 = 10
The sample mean is therefore 10.
If those three observations came from a larger population, x̄ could be used as an estimate of the population mean μ.
Population Mean vs. Sample Mean: A Simple Example
Imagine a box contains 1,000 manufactured parts.
You want to know their average weight.
Scenario A: You weigh all 1,000 parts
You have the entire population.
The resulting mean is:
μ
Scenario B: You randomly weigh 50 parts
You have a sample.
The resulting mean is:
x̄
You can then use x̄ to estimate μ.
This is the basic logic behind statistical sampling and inference.
Common Mistakes With the Population Mean Symbol
Mistake 1: Using x̄ for the population mean
Wrong in standard notation: x̄ = population mean
Correct: μ = population mean
x̄ normally represents a sample mean.
Mistake 2: Confusing μ with σ
μ represents the population mean.
σ represents the population standard deviation.
Mistake 3: Confusing N and n
A common convention is:
N = population size
n = sample size
Mistake 4: Assuming μ always means mean
Symbols depend on context. μ is a conventional symbol for population mean in statistics, but it can represent other concepts in other fields.
Mistake 5: Thinking the population must mean people
In statistics, a population can consist of people, animals, products, measurements, transactions, test results, or other defined observations.
Does Population Mean Always Have to Be Known?
No.
This is an important concept.
A population mean can exist even if researchers don’t know its numerical value.
For example, the average true lifetime of every product produced by a factory could be considered a population parameter even if the company doesn’t test every product.
Researchers can collect sample data and estimate the unknown population mean.
Penn State describes this distinction between population parameters and sample statistics as a central part of statistical inference.
What Is the Difference Between a Parameter and a Statistic?
This distinction makes μ and x̄ much easier to understand.
Parameter
A parameter describes a population.
Example:
μ = population mean
Statistic
A statistic describes a sample.
Example:
x̄ = sample mean
So:
μ → parameter → population
x̄ → statistic → sample
This is one of the most useful relationships to memorize when learning statistics.
Does Every Population Mean Use μ?
In standard introductory statistics notation, μ is the conventional symbol for a population mean.
However, notation can vary among textbooks, academic disciplines, software packages, and research contexts.
Some sources may use other notation when a more specific variable or distribution needs to be identified.
The safest approach is always to check the notation defined in the problem, textbook, paper, or course you’re using.
Still, for standard statistics questions asking for the symbol for population mean, the expected answer is:
μ
Population Mean and the Law of Large Numbers
The population mean also connects to an important idea in probability: the law of large numbers.
As the number of observations in a suitable random sample increases, the sample average tends to get closer to the population mean under the conditions of the relevant law.
That helps explain why larger, well-designed samples can provide useful information about an unknown population mean.
However, “larger” doesn’t automatically mean “better.”
Sampling bias, measurement problems, nonresponse, and poor study design can still produce misleading results.
Population Mean and Sampling Error
Suppose you take two different random samples from the same population.
You may get:
Sample 1: x̄ = 48.7
Sample 2: x̄ = 51.2
Both sample means can differ even though they come from the same population.
That’s because samples don’t necessarily contain exactly the same observations.
This natural variation is related to sampling error.
The population mean μ is fixed for the defined population, while x̄ can change from sample to sample. NIST notes that different samples from the same population can generate different sample means.
Why the Population Mean Matters
The population mean is useful because it gives researchers a way to describe the center of a population numerically.
It appears in:
- Descriptive statistics
- Probability
- Statistical inference
- Hypothesis testing
- Confidence intervals
- Experimental research
- Survey research
- Quality control
- Data science
- Economics
- Psychology
- Medicine
- Education
- Business analytics
- Scientific research
The symbol may be tiny, but the concept is fundamental.
Quick Comparison: μ, x̄, σ, and s
If you’re studying for an exam, this table is worth remembering:
| Symbol | What it means | Population or sample? |
|---|---|---|
| μ | Mean | Population |
| x̄ | Mean | Sample |
| σ | Standard deviation | Population |
| s | Standard deviation | Sample |
A simple memory pattern is:
Greek letters → commonly used for population parameters
Roman/sample notation → commonly used for sample statistics
This is a convention rather than a universal rule for every statistical symbol.
Frequently Asked Questions
What is the symbol for population mean?
The standard symbol for the population mean is μ, the lowercase Greek letter mu.
What is μ called in statistics?
μ is called mu. In standard statistics notation, it represents the population mean.
What is the formula for population mean?
The standard formula is:
μ = Σx / N
where μ is the population mean, Σx is the sum of all population values, and N is the population size.
What is the symbol for sample mean?
The standard symbol for sample mean is x̄, pronounced x-bar.
Is μ the population or sample mean?
μ represents the population mean.
The sample mean is usually represented by x̄.
What is the difference between μ and x̄?
μ describes the mean of the entire population, while x̄ describes the mean calculated from a sample.
What does N mean in the population mean formula?
N commonly represents the total number of observations in the population.
What does n mean in statistics?
n commonly represents the number of observations in a sample.
What does Σ mean in the population mean formula?
Σ is the capital Greek letter sigma and means to sum or add the specified values.
Is μ the same as average?
μ represents the population arithmetic mean. In everyday language, that is often called the population average.
Is μ the same as standard deviation?
No.
μ = population mean
σ = population standard deviation
How do you say μ?
It is pronounced “mu,” approximately “myoo.”
Can I copy the population mean symbol?
Yes. Here it is:
μ
What is the population mean symbol in LaTeX?
Use:
\mu
Can μ mean something else?
Yes. Mathematical symbols depend on context. In statistics, μ commonly means population mean, but other fields may assign different meanings to the symbol.
Population Mean Symbol Cheat Sheet
If you’re looking for a quick answer, here’s the complete cheat sheet:
Population mean: μ
Name: Greek lowercase mu
Pronunciation: “myoo”
Meaning: Mean of an entire population
Formula: μ = Σx / N
Population size: N
Sample mean: x̄
Sample size: n
Population standard deviation: σ
Summation symbol: Σ
Population mean type: Parameter
Sample mean type: Statistic
Final Takeaway
The symbol for population mean is μ (mu).
It represents the arithmetic average of all observations in a defined population. The standard formula is μ = Σx/N, where you add every population value and divide by the total number of values.
The most important distinction to remember is:
μ = population mean
x̄ = sample mean
When researchers don’t have data for an entire population, they often calculate x̄ from a sample and use it to estimate the unknown population mean μ.
Once you understand that difference, many statistics formulas become much easier to read. The next time you see μ in a statistics problem, you’ll know exactly what it represents: the mean of the population.
descover more post
What Does the Evil Eye Symbol Mean History 🧿 Nazar …
What Does the 🪐 Symbol Mean Complete Guide to …
Sample Mean Symbol Definition Formula How to Type It …

About Zoya
Zoya is the author and content creator behind DreamETrue, where she shares well-researched articles about dream meanings, dream symbolism, and interpretations from cultural, spiritual, and psychological perspectives.
Her goal is to make dream-related topics simple, trustworthy, and easy to understand for readers around the world. Every article is carefully written with a focus on clarity, accuracy, and providing genuine value, helping readers explore the fascinating world of dreams with confidence.
Through DreamETrue, Zoya is committed to publishing original, informative, and reader-focused content that follows high editorial standards. Whether you’re curious about a recurring dream or looking for the meaning behind a specific dream symbol, her mission is to provide reliable guidance in a clear and engaging way.
When she’s not researching dream symbolism, Zoya enjoys reading, learning about human psychology, and creating helpful content that inspires curiosity and understanding.